Berkshire Hathaway Revenue and Growth Statistics (2024)

Key Berkshire Hathaway user stats. Includes data on Berkshire Hathaway's revenue, owner's net worth, profit, and more.
Berkshire Hathaway Revenue and Growth Statistics (2024)
Last updated on:
December 29, 2023
Want more research posts like these for FREE?
Want more insights like these for FREE?

Berkshire Hathaway Interesting Key Facts

  • Warren Buffet, one of the founders and the CEO of Berkshire Hathaway, is known as the Oracle of Ohama.
  • Warren Buffet is considered one of the most successful investors of all time.
  • Warren Buffet bought his first stock at the age of 11.
  • Warren Buffet promised to donate 99% of his wealth.
  • Warren Buffet and Bill Gates launched the Giving Pledge in 2010, it’s a commitment where billionaires from across the world would donate half of their wealth to charitable causes.
  • At the age of 92, Warren Buffet’s favorite feasts are still colas, ice creams, burgers, hotdogs, and other assortments of fast foods.
  • In 2015, Warren Buffet told Fortune that he is “one-quarter Coca-Cola” as he consumes at least five cans of soda every single day.
  • Berkshire Hathaway was formerly known as the Valley Falls company which then merged with the Berkshire Cotton Manufacturing Company becoming Berkshire Fine Spinning Associates in 1929.
  • In 1955, Berkshire Fine Spinning Associates merged with Hathaway Manufacturing Company which then gave birth to Berkshire Hathaway Company.
  • Berkshire Hathaway categorized their shares into two classes: Class A and Class B. They did this so others can afford their shares.
  • Berkshire Hathaway's class A is considered as the highest-priced shares on the New York Stock Exchange.
  • One Class B share (BRK.B) is equivalent to 1/1500 Class A share (BRK.A).
  • Class A shares cannot be and should not be split as Warren Buffet believes that it will attract “like-minded” investors.

Source: CNBCTV, Forbes, Giving Pledge, Projo, Stock Analysis, Business Insider, Investopedia, Mashed

Berkshire Hathaway: Conglomerate Overview (About)

Join us and check out an overview of Berkshire Hathaway as a company.

Quick look:

Key statKey info
FormerlyValley Falls Company (1839-1929) Berkshire Fine Spinning Associates (1929-1955)
Founded1839, Cumberland, Rhode Island, U.S.
Founders:Oliver Chace, Warren E. Buffet
TypePublic
IndustryConglomerate
HeadquartersKiewit Plaza, Omaha, Nebraska , U.S.
Traded asNYSE: BRK.A (Class A), NYSE: BRK.B (Class B), SandP 100 component (BRK.B), SandP 100 component (BRK.B)
Area ServedGlobal
ProductsDiversified investments, Property and casualty insurance, Utilities, Restaurants, Food processing, Aerospace, Toys, Media, Automotive, Sporting goods, Consumer products, Internet, Real estate
Key PeopleWarren E. Buffet, Charles T. Munger
Revenue$276.1 billion (2021)
Operating Income$111.7 billion (2021)
Net Income$89.8 billion (2021)
Total Assets$958.8 billion (2021)
Total Equity$514.9 billion (2021)
OwnerWarren Buffet (30.71% of the aggregate voting power and 16.45% of the economic interest)
Number of employees372,000 (2021)

Sources: Forbes, Berkshire Hathaway, SEC

Warren Buffet Net Worth Through the years

Warren Buffet's net worth as of 2022 was of $109 billion.

Known as one of the wealthiest people in the world, Warren Buffet has amassed his wealth through his ingenious investment strategies.

Graph about Warren Buffet's net worth

The table below presents us his net worth through the years according to Forbes.

YearNet Worth
2013$53.5 billion
2014$58.2 billion
2015$72.7 billion
2016$60.8 billion
2017$75.6 billion
2018$84 billion
2019$82.5 billion
2020$67.5 billion
2021$96 billion
2022$109.2 billion

This table is just amazing. Note how ever since 2013, Warren Buffet's net worth doubled.

Source: Forbes

What is Berkshire Hathaway's Revenue?

As of 2021, Berkshire Hathaway had revenue of $276.09 with a 12.46% increase from 2020.

Graph about Berkshire Hathaway's revenue
YearRevenueY/Y Change
1993$3.70 billion
1994$3.91 billion5.68% increase
1995$4.56 billion16.62% increase
1996$10.50 billion130.26% increase
1997$10.43 billion-0.67% decrease
1998$14.01 billion34.32% increase
1999$24.89 billion77.66% increase
2000$34.85 billion40.02% increase
2001$38.59 billion10.73% increase
2002$42.23 billion9.43% increase
2003$63.86 billion51.22% increase
2004$74.38 billion16.47% increase
2005$81.66 billion9.79% increase
2006$98.54 billion20.67% increase
2007$118.25 billion20.00% increase
2008$107.79 billion-8.85% decrease
2009$112.49 billion4.36% increase
2010$136.19 billion21.0685% increase
2011$143.69 billion5.51% increase
2012$162.46 billion13.06% increase
2013$182.41 billion12.28% increase
2014$194.70 billion6.74% increase
2015$210.82 billion8.28% increase
2016$223.60 billion6.06% increase
2017$240.65 billion7.63% increase
2018$247.84 billion2.99% increase
2019$254.62 billion2.74% increase
2020$245.51 billion-3.58% decrease
2021$276.09 billion12.46% increase

In 1993, Berkshire Hathaway's revenue was of almost $4 billion. Not that 1993's revenue is small, but if you look at the number in 2021, numbers go up by a lot more.

Have a look at 2021! Berkshire Hathaway's revenue was of $276 billion.

Source: Google Finance, Berkshire Hathaway

Revenue breakdown earned among Berkshire Hathaway’s businesses

The table below shows us the revenue earned among Berkshire Hathaway's businesses by industry category.

As we can see, the largest portion of the conglomerate’s revenue comes from its insurance businesses (27%).

Graph about Revenue breakdown earned among Berkshire Hathaway’s businesses
Business Industry CategoryPercentage
Insurance27%
Manufacturing25%
McLane Company18%
Service and Retailing13%
Berkshire Hathaway Energy9%
BNSF8%

Not far away from the insurance business, Berkshire Hathaway's second most successful industry is the manufacturing industry, with 25% of the total revenue.

Source: SEC

What is Berkshire Hathaway’s Profit throughout the years?

Berkshire Hathaway has a profit of $89.80 billion in 2021, an increase of 111.18% on year-over-year growth. As of Q3 2022, the company has a profit of -$2.69 billion.

Graph about Berkshire Hathaways Profit
YearProfitY/Y Change
1994$553 million
1995$794.9 million43.74% increase
1996$2.45 billion208.22% increase
1997$1.90 billion-22.449% decrease
1998$2.83 billion48.95% increase
1999$1.56 billion-44.88% decrease
2000$3.33 billion113.46% increase
2001$795 million-76.13% decrease
2002$4.29 billion439.62% increase
2003$8.15 billion89.98% increase
2004$7.31 billion-10.31% decrease
2005$8.53 billion16.69% increase
2006$11.01 billion29.07% increase
2007$13.21 billion19.98% increase
2008$4.99 billion-62.23% decrease
2009$8.06 billion61.52% increase
2010$12.97 billion60.92% increase
2011$10.25 billion-20.97% decrease
2012$14.82 billion44.59% increase
2013$19.48 billion31.44% increase
2014$19.87 billion2.00% increase
2015$24.08 billion21.19% increase
2016$24.07 billion-0.04% decrease
2017$44.94 billion86.67% increase
2018$4.02 billion-91.05% decrease
2019$81.42 billion1,924.79% increase
2020$42.52 billion-47.77% decrease
2021$89.80 billion111.18% increase

Looking at the data with Berkshire Hathaway's revenue, you can see how the company had both years with an increase and a decrease in revenue.

Source: Google Finance, Berkshire Hathaway

How many companies does Berkshire Hathaway own?

As of November 2022, Berkshire Hathaway owns more than 70 companies and has share holdings on hundreds of other companies.

Infographic about Berkshire Hathaway number of companies

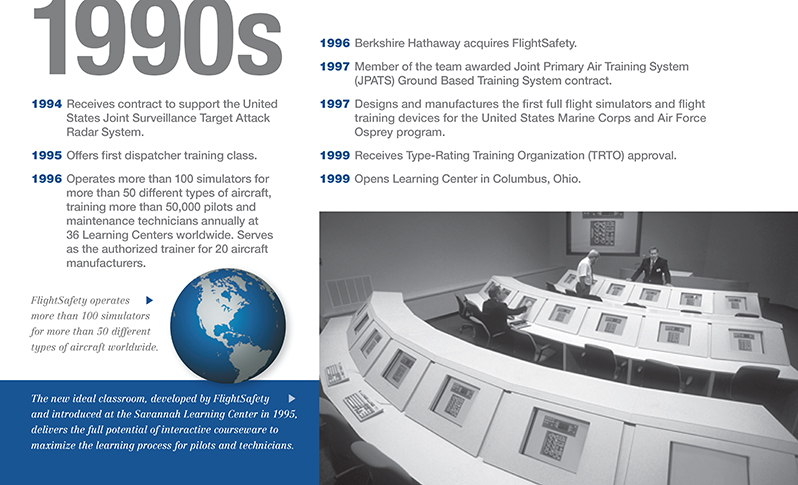
Source: Liberated Stock Trader, Brick, AltaLink, Berkshire Hathaway 1, Berkshire Hathaway 2, Berkshire Hathaway 3, Berkshire Hathaway 4, Berkshire Hathaway 5, Berkshire Hathaway 6, Berkshire Hathaway 7, Berkshire Hathaway 8, Berkshire Hathaway 9, Automotive News, Borsheims, Businesswire 1, Fortune, Clayton Homes, Businesswire 2, NBCDFW, Flight Safety, Fruit of the Loom, GEICO, Genre, Helzberg, New York Times, McLane, National Indemnity Company, NFM, SEC, Omaha, Oriental Trading, USA Today, Precision Brand, TSLT

How does Berkshire Hathaway make money?

Berkshire Hathaway makes money through its various businesses in almost every industry.

Its top earning businesses are those from the insurance industry, manufacturing industry, McLane company, service and retailing company, Bekshire Hathaway Energy, and the BNSF.

Infographic about How does Berkshire Hathaway make money

Sources: SEC, Investopedia

Berkshire Hathaway Market Capitalization

Berkshire Hathaway has a market cap of $675.13 billion in 2022. Also, the company has a stock price of ~462,700 per share.

Though, stocks are generally volatile, so the number is likely to go up & down fast.

Source: Google Finance

Berkshire Hathaway Financials

As one of the largest companies in the world, Berkshire Hathaway's price per share is one of the highest-priced of any U.S. Company.

In the following subsections, we will have a thorough look at this company’s financial data through the years.

Source: Google Finance

What is Berkshire Hathaway's EBITDA throughout the years?

In 2021, Berskhire Hathaway has an EBITDA of over $125 billion, an increase of 56.36% in year-over-year growth. The company has a -$738.00M EBITDA as of Q3 2022.

YearEBITDAY/Y Change
2017$34.40 billion-23.90% decrease
2018$120.18 billion-41.33% decrease
2019$115.64 billion472.99% increase
2020$80.32 billion-30.55% decrease
2021$125.58 billion56.36% increase

The year of 2021 saw the highest EBITDA at Berkshire Hathaway, rated at $125.58 billion.

Source: Google Finance

EBITDA breakdown among Berkshire Hathaway’s businesses

Berkshire Hathaway’s EBITDA comes mostly from its manufacturing businesses according to a document from SEC.

Business Industry CategoryPercentage
Manufacturing31%
BNSF24%
Insurance20%
Service and Retailing14%
Berkshire Hathaway Energy10%
McLane Company1%

After the manufacturing industry, Berkshire Hathaway's EBITDA also comes a lot from the BNSF category (24%).

Source: SEC

What is Berkshire Hathaway’s Net Profit Margin throughout the years?

As of 2021, Berkshire Hathaway's net profit margin was of 32.52, with an increase of almost 88% than in 2020.

YearNet Profit MarginY/Y Change
201718.6767.44% increase
20181.62-91.32% decrease
201931.981,874.07% increase
202017.32-45.84% decrease
202132.5287.76% increase

In 2019, Berkshire Hathaway's net profit margin was close to the highest one, recorded in n 2021.

Source: Google Finance

What are Berkshire Hathaway’s Earnings Per share throughout the years?

As of 2021, Berkshire Hathaway earns 12.12 per share, with a 32% increase than in 2020's earning per share.

YearEarnings Per ShareY/Y Change
20178,79067.44% increase
201815,080-91.32% decrease
20199.78-99.94% decrease
20209.17-6.29% decrease
202112.1232.23% increase

Note how Berkshire Hathaway's highest earning per share was recorded in 2018, with 15 per share.

Source: Google Finance

What is Berkshire Hathaway’s effective tax rate throughout the years?

Berkshire Hathaway's effective tax rate was of 18.69% in 2021.

Check out this table to see the situation in the past few years.

YearEffective Tax Rate
2017-90.25%
2018-8.02%
201920.36%
202022.34%
202118.69%

The highest effective tax rate at Berkshire Hathaway was in 2020, with 22.34%.

Also, the lowest effective tax rate at the company was in 2017, with -90.25%.

Source: Google Finance

What are Berkshire Hathaway's Cash and Short-term Investments Through the Years?

Latest data shows that Berkshire Hathaway's cash and short-term investments were of $146.72 billion in 2021.

YearCash and Short-Term InvestmentsY/Y Change
2017$115.95 billion54.90% increase
2018$111.87 billion-3.52% decrease
2019$128 billion14.42% increase
2020$138.29 billion8.04% increase
2021$146.72 billion6.10% increase

Note how every new year at Berkshire Hathaway had the cash and short-term investments' numbers going up by quite a few millions.

Source: Google Finance

What are Berkshire Hathaway’s Total Assets Through the Years?

Berkshire Hathaway has assets worth over $958.78 billion. Latest data was recorded in 2021.

The table below shows some of the past few years' values.

YearTotal AssetsY/Y Change
2017$702.10 billion13.09% increase
2018$707.79 billion0.81% increase
2019$817.73 billion15.53% increase
2020$873.73 billion6.85% increase
2021$958.78 billion9.73% increase

Berkshire Hathaway's total assets went up by 9.73% in 2021 compared to 2020's total assets.

Source: Google Finance

What are Berkshire Hathaway’s Total Liabilities Through the Years?

Berkshire HAthaway's  total liabilities were of $443.85 billion in 2021, as shown by the most recent report.

YearTotal LiabilitiesY/Y Change
2017$350.14 billion4.39% increase
2018$355.29 billion1.47% increase
2019$389.17 billion9.53% increase
2020$422.39 billion8.54% increase
2021$443.85 billion5.08% increase

As for liabilities, they are also expected to go up at Berkshire Hathaway.

Source: Google Finance

What is Berkshire Hathaway’s Total Equity Through the Years?

Total equity at the company was of $514.93 billion in 2021, as said in the last official report.

YearTotal Equity
2017$351.95 billion
2018$352.50 billion
2019$428.56 billion
2020$451.34 billion
2021$514.93 billion

Source: Google Finance

What are Berkshire Hathaway’s Shares Outstanding Through the Years?

In 2021, Berkshire Hathaway's shares outstanding were of 1.48 million in 2021.

YearShares Outstanding
20171.65 million
20181.64 million
20191.62 million
20201.53 million
20211.48 million

You can see in this table how the past few years had higher numbers for the outstanding shares at Berkshire Hathaway.

Source: Google Finance

What is Berkshire Hathaway’s Price to Book Through the Years

The price-to-book ratio at Berkshire Hathaway was of 1.38 in 2021.

Use the table below to see the value in the past few years.

YearPrice-to-Book Ratio
20172.23
20182.23
20191.81
20201.65
20211.38

This table indicates that the highest price-to-book ratio at Berkshire hathaway was in 2017 and 2018, at 2.23.

Source: Google Finance

What is Berkshire Hathaway's Return on Assets Through the Years?

The return on assets at Berkshire Hathaway was of 7.83% in 2021.

YearReturn on Assets
20172.38%
20180.92%
20198.65%
20205.15%
20217.83%

The lost return on assets was recorded in 2018, at 0.92%.

Source: Google Finance

What is Berkshire Hathaway's Return on Capital Through the Years?

Berkshire Hathaway's return on capital was of 11.89% in 2021.

YearReturn on Assets
20173.74%
20181.44%
201913.36%
20207.84%
202111.89%

As for the lowest return on capital at Berkshire Hathaway, this was in 2018, recorded at 1.44%.

Source: Google Finance

What is Berkshire Hathaway’s Cash From Operations Through the Years?

Berkshire Hathaway's cash from operations was of 11.89% in 2021. That is a decrease of 0.89% from 2020's value.

YearCash from OperationsY/Y Change
20173.74%40.07% increase
20181.44%-18.21% decrease
201913.36%3.44% increase
20207.84%2.81% increase
202111.89%-0.89% decrease

At the same time, Berkshire Hathaway's lowest cash from operations was in 2018, at 1.44% of the total operations.

Source: Google Finance

What is Berkshire Hathaway’s Cash From Investing Through the Years?

In 2021, Berkshire Hathaway had 23.39 billion cash from investing. That's 177.85% times higher than 2020's value.

YearCash from InvestingY/Y Change
2017-41.01 billion51.31% increase
2018-32.85 billion19.90% increase
2019-5.62 billion82.89% increase
2020-37.76 billion-571.71% decrease
202129.39 billion177.85% increase

Though, 2020 was not the lowest value. In 2017, Berkshire Hathaway had the lost cash from investing, at -$41.01 billion.

Source: Google Finance

What is Berkshire Hathaway’s Cash From Financing Through the Years?

Berkshire Hathaway's cash from financing in 2021 was of -$28.51 billion.

YearCash from FinancingY/Y Change
2017-1.40 billion-110.93% decrease
2018-5.81 billion-315.74% decrease
2019730 million112.56% increase
2020-18.34 billion-2,612.88% decrease
2021-28.51 billion-55.41% decrease

The highest cash from financing at Berkshire Hathaway was recorded in 2019, at $730 million.

Source: Google Finance

What is Berkshire Hathaway's Net Change in Cash Through the Years?

The most recent data shows that Berkshire Hathaway's net change in cash was of $40.31 billion in 2021.

YearNet Change in CashY/Y Change
20173.75 billion109.16% increase
2018-1.40 billion-139.25% decrease
201933.82 billion2,514.06% increase
2020-16.24 billion-148.01% decrease
202140.31 billion348.28% increase

As for the lowest net change in cash, Berkshire Hathaway saw the lowest value in 2020, at -$16.24 billion.

Source: Google Finance

What is Berkshire Hathaway's Free Cash Flow Through the Years?

In 2021, Berkshire Hathaway's free cash flow was of $61.70 billion. That is almost 50% higher than in 2020.

YearCash FlowY/Y Change
201726.80 billion252.27% increase
2018-2.52 billion-109.39% decrease
201954.10 billion2,250.80% increase
202041.72 billion-22.89% decrease
202161.70 billion47.90% increase

In 2018, Berkshire Hathaway's saw its lowest free cash flow, at -$2.52 billion.

Source: Google Finance

What are Berkshire Hathaway's Latest Investments?

These are Berkshire Hathaway’s latest investments.

Announced DateOrganization NameLead InvestorFunding RoundMoney Raised
Sep 30, 2022Taiwan Semiconductor Manufacturing CompanyYesPost-IPO Equity - Taiwan Semiconductor Manufacturing Company$4.1 billion
Sep 29, 2022Occidental PetroleumYesPost-IPO Equity - Occidental Petroleum$352 million
Apr 6, 2022HPYesPost-IPO Equity - HP$4.2 billion
Mar 5, 2022Occidental PetroleumYesPost-IPO Equity - Occidental Petroleum$5.1 billion
Feb 16, 2022NubankYesPost-IPO Equity - Nubank$1 billion
Dec 1, 2021Activision BlizzardYesPost-IPO Equity - Activision Blizzard$975 million
Sep 9, 2021Extraordinaire Advantage CorporationYesSeries A - Extraordinaire Advantage Corporation$3 million
Jun 8, 2021NubankYesSeries G - Nubank$750 million
May 17, 2021Aon plcYesPost-IPO Equity - Aon plc$942.6 million
Jul 28, 2020Bank of AmericaYesPost-IPO Equity - Bank of America$400 million

Source: Crunchbase

Top Berkshire Hathaway’s Stock Holdings

The following table shows us Berkshire Hathaway’s stock holdings portfolio breakdown.

It also shows us how much outstanding shares Berkshire Hathaway has on these companies and corporation.

Graph about Top Berkshire Hathaway’s Stock Holdings
Company/Corporation% on Stock Holding PortfolioShares Owned% of Shares OutstandingValue
Apple Inc.40%895 million shares5.96%$126.5 billion
Bank of America Corporation11.50%1.03 billion shares11.70%$31.2 billion
Chevron Corporation9.30%165.3 million shares8.50%$24.4 billion
Coca-Cola Company7.30%400 million shares9%$22.4 billion
American Express Company6.80%151 million shares20%$20.5 billion
Occidental Petroleum Corporation4.50%194.4 million shares20.87%$11.9 billion
Kraft Heinz Co3.60%325.7 million shares26.58%$12.7 billion
Moody's Corporation2.20%24.7 million shares13.47%$6 billion
Activision Blizzard1.60%60.1 million shares7.69%$4.5 billion
Taiwan Semiconductor1.30%60.1 million shares$4.1 billion
Others7.40%

The last row, “others’’, represents other companies and corporations with decimal percentages that are part of Berkshire Hathaway.

Presently, Berkshire Hathaway stock portfolio is worth more than $300 billion comprised by 53 positions.

Source: Capital, Fool 1, Fool 2, Investopedia, NASDAQ, Reuters, Fintel, Investors

Berkshire Hathaway Class B Funding History

There have been two transactions recorded in the Class B funding for Berkshire Hatahway. They are as follows:

Announced DateTransaction NameNumber of InvestorsMoney RaisedLead Investors
September 27, 2022Post-IPO Equity - Berkshire Hathaway1$68 millionGregory E. Abel
August 15, 2019Post-IPO Equity - Berkshire Hathaway1$3.5 millionPershing Square Capital Management

Source: Crunchbase

How many people work for Berkshire Hathaway worldwide?

In 2021, Berkshire Hathaway has 372,000 employees.

Graph about Berkshire Hathaway number of employees

This table represents Berkshire Hathaway’s number of employees throughout the years across the entirety of the world.

YearNumber of Employees
2016367,671
2017377,000
2018389,000
2019391,500
2020360,000
2021372,000

Berkshire Hathaway had the most employees in 2018, at the value of 389,000.

The lowest amount of employees at Berkshire Hathaway was in 2016, with 367,671 people working for the company.

Source: Business Insider

Berkshire Hathaway Acquisitions

Berkshire Hathaway currently owns 72 companies and 59 of these are 100% owned.

CompanySectorOwnershipAcquisition DateAcquisition Price
Berkshire Hathaway Home Services Cancun PropertiesReal Estate 
Acme Brick CompanyMaterials and Construction100%2000/08/01~$600 Million ($4,392.65 Million 2017)
Alleghany CorporationInvestment Holding100%2022/03/21$11.6 billion
AltaLinkElectric Transmission92%2014/12/01C$3.24 Billion
Ben Bridge JewelerLuxury Items100%2000/07/18 
Benjamin Moore and Co.Materials and Construction100%2001/01/01$1 Billion
BerkadiaMortgage Financing50%2009/12/31 
Berkshire Hathaway AssuranceBond Insurance100%2007/12/01 
Berkshire Hathaway AutomotiveAutosales90%2015/05/09 
Berkshire Hathaway EnergyUtilities92%1999/03/26 
BoatUSInsurance2007/07/27 
Borsheim's Fine JewelryLuxury Items100%1989/01/01 
Brooks SportsApparel100%2006/08/02 
BNSF Railway CompanyRailroads and Logistics100%2010/02/12$34 Billion
Business WireMedia100%2006/03/01 
Cavalier HomesMaterials and Construction100%2008/01/01 
Central States IndemnityInsurance and Finance100%1992/10/20 
Charter BrokerageLogistics100%2014/12/12 
Clayton HomesMaterials and Construction100%2007/05/10$1.7 billion
CORT Business ServicesFurniture Related100%2000/01/14$467 Million ($3,418.94 Million 2017)
CTB Inc.Capital Goods100%2002/01/01 
Dairy QueenFood and Beverage99%1997/10/21$585 Million
DuracellHousehold Products100%2016/02/29$1.8 billion
Ebby Halliday CompaniesReal Estate100%2018/06/04 
Fechheimer Brothers CompanyClothing100%1986/01/01 
FlightSafety InternationalBusiness Services100%1997/01/01 
Forest RiverMaterials and Construction100%2005/08/31 
Fruit of the LoomClothing100%2002/04/30$835 Million
GaranimalsClothing100%2002/09/04$2.3 Billion
GEICOInsurance and Finance100%1996/08/26$22 Billion
General ReInsurance and Finance100%1995/12/21 
Helzberg DiamondsLuxury Items100%1995/01/01 
H.H. Brown Shoe GroupClothing100%1991/07/01 
International Metalworking CompaniesMaterials and Construction100%2006/05/08 
Johns ManvilleMaterials and Construction100%2001/02/27$1.8 Billion
Jordan's FurnitureFurniture Related100%1999/10/11 
Justin BrandsClothing100%2000/08/01$570 Million
Kansas Bankers Surety CompanyInsurance and Finance100%1998/04/10 
Kern River PipelinePipeline92%2006/03/21$960 Million
Larson-JuhlFurniture Related100%2001/12/17 
Louis MotorMotorcycles100%2015/02/20 
LubrizolChemicals100%2011/09/16$9.7 Billion
Marmon GroupDiversified Holding Company99%2008/01/01$4.5 Billion
McLane CompanyLogistics100%2003/05/23$1.45 Billion
Medical ProtectiveLiability Insurance100%2005/06/30 
MiTekMaterials and Construction90%2001/06/12 
National Indemnity CompanyInsurance and Finance100%1967/03/01$6.8 Million ($49.78 Million inflation adjusted)
Nebraska Furniture MartFurniture Related80%1983/01/01$60 Million
NetJetsBusiness Services100%1998/01/01$725 Million
NetJets EuropeBusiness Services100%1998/01/01 
Northern Natural GasPipeline92%2002/08/01$928 Million
NV EnergyElectric and Gas Distribution92%2013/12/19$5.6 Billion
Omaha World-HeraldMedia100%2011/12/01$150 Million
Oriental Trading CompanyToy Party Craft100%2012/01/01 
PacifiCorpElectric Distribution92%2005/01/01$9.4 billion
Pampered ChefFood and Beverage100%2002/09/23 
Pilot Flying JRetail, Food and Beverage, Petroleum38.60%2017/10/03 
Precision Castparts Corp.Aerospace and Defense100%2016/01/29$37 Billion
Precision Steel Warehouse, Inc.Materials and Construction100%1979/01/01 
RC Willey Home FurnishingsFurniture Related100%1995/01/01 
Richline GroupWholesale and Manufacturing100%2007/05/01 
Russell BrandsSports Equipment Manufacturer100%2006/01/01$600 Million
Scott Fetzer CompanyOther100%1985/01/01$230 Million
See's CandiesFood and Beverage100%1972/01/03$25 Million
SE HomesMaterials and Construction100%2007/01/01 
Shaw IndustriesMaterials and Construction100%2002/01/21 
Star FurnitureFurniture Related100%1997/07/14 
TTI, Inc.Electronic Component Distribution100%2007/03/30 
United States Liability Insurance GroupInsurance and Finance100%2000/08/08 
Wesco FinancialInsurance and Finance100%1978/01/01 
WPLG-TVMedia100%2014/07/01 
XTRA LeaseCommercial Semi Trailer Rental and Leasing100%2001/09/20

Sources: Brick, AltaLink, Berkshire Hathaway 1, Berkshire Hathaway 2, Berkshire Hathaway 3, Berkshire Hathaway 4, Berkshire Hathaway 5, Berkshire Hathaway 6, Berkshire Hathaway 7, Berkshire Hathaway 8, Berkshire Hathaway 9, Automotive News, Borsheims, Businesswire 1, Fortune, Clayton Homes, Businesswire 2, NBCDFW, Flight Safety, Fruit of the Loom, GEICO, Genre, Helzberg, New York Times, McLane, National Indemnity Company, NFM, SEC, Omaha, Oriental Trading, USA Today, Precision Brand, TSLT

Berkshire Hathaway Website Traffic Analysis

Below you can see daily, monthly, and other interesting data about Berkshire Hathaway's website.

Key StatKey Info
Daily Unique Visitors22,936
Monthly Visits694,961
Pages per Visitor2.7
Daily Pageviews61,928
Monthly Visits (SEMrush)551,207
Monthly Unique Visitors (SEMrush)402,729
Monthly Visits (SimilarWeb)688,090
Alexa Rank34,591
Alexa Reach0.00%
Bounce rate74.49%

Source: HypeStat

Berkshire Hathaway Website Traffic Sources

Most of the traffic driven to Berkshire Hathaway's website is direct, with 52.35% of the total traffic.

Direct Sources52.35%
Referral Sources6.21%
Search Sources38.85%
Social Sources2.58%
Paid Sources0%

Source: HypeStat

How much time do people spend on Berkshire Hathaway’s website?

The average time people spend on their website is: 2 minutes and 44 seconds.

Infographic about average time people spend on Berkshire Hathaway

Source: HypeStat

FAQs

No items found.

Want more of this, for free?

Hey! 👋 Over here, at SignHouse, we're producing more of what you just read.
Get our very quick email updates that we send to 1,000s of people. 100%-off invitations to access paid products for $0, value-packed emails + more

About the author

Ch Daniel is the co-founder of SignHouse and chairman of the CH Group. Daniel is leading the development of SignHouse's product, as well as strategising how else the company can reach its main mission: empowering 100M+ to use the world's most efficient document organisational tools.